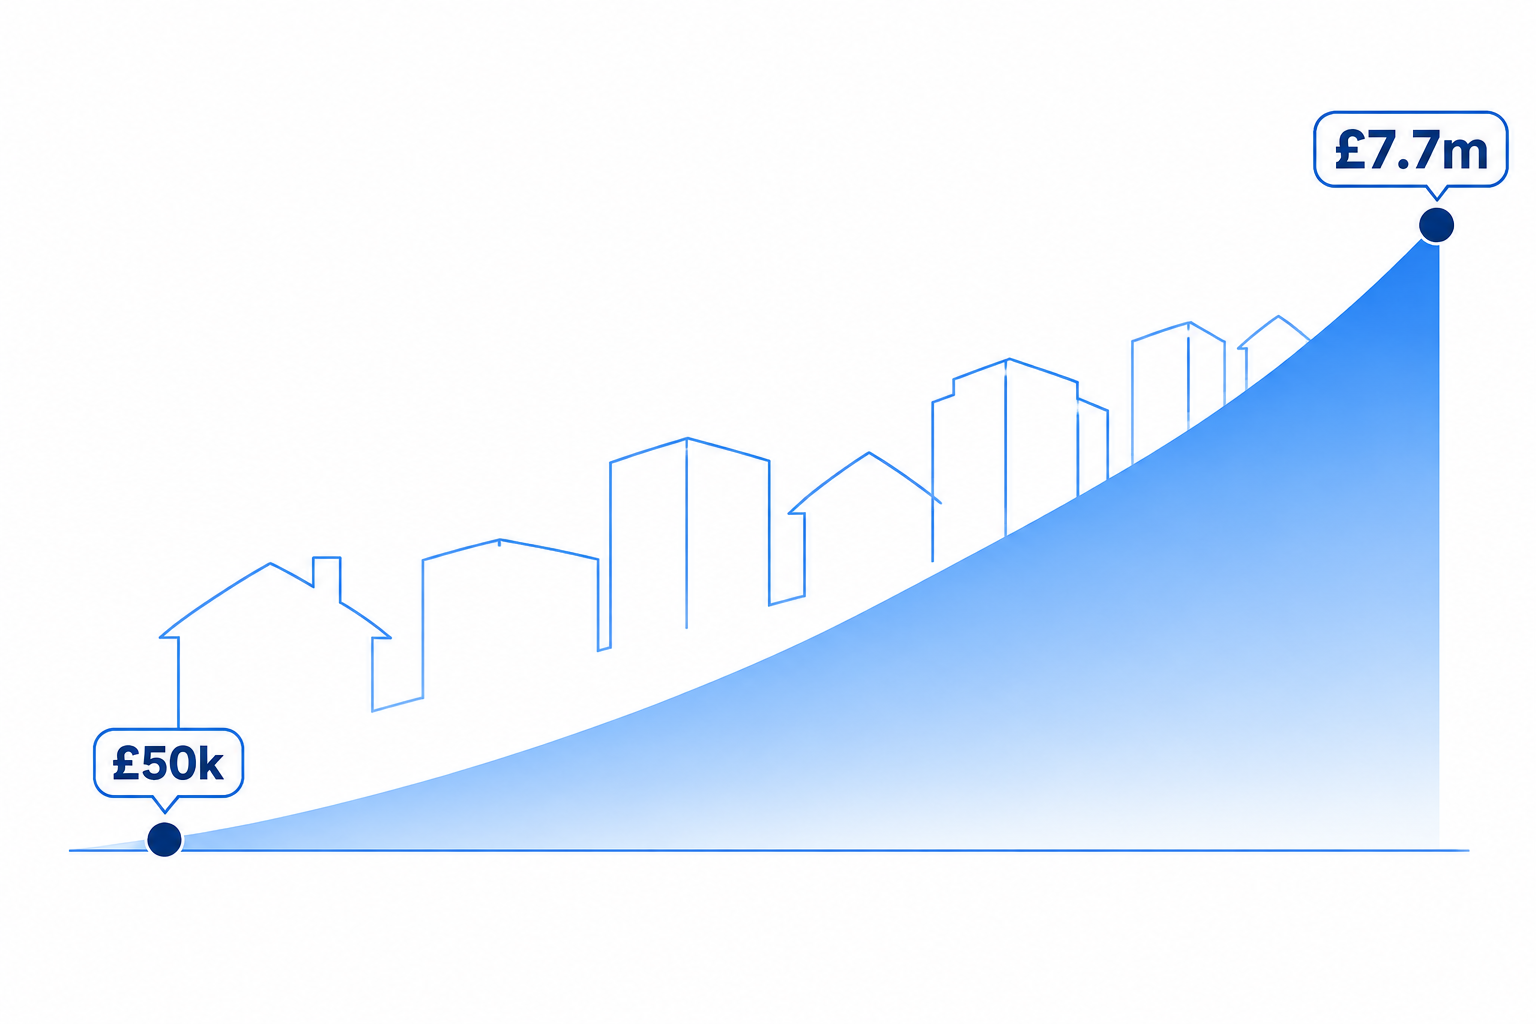
As margins tighten across the UK property sector, getting your project finance right is no longer just a metric for the finance department. It’s now the difference between scaling, or even simply surviving, versus choking your business growth entirely.
Optimising your capital structure comes down to two distinct variables: the absolute cost of finance and the efficient deployment of equity. When you perfectly balance both, you unlock the prime level of funding for your project every single time. It’s exactly what the Brickflow platform was engineered to do.
Yet we regularly speak to experienced property investors who’ve spent weeks, or even months, drilling contractors to shave £100 off here, £200 off there, costing every brick and pipe down to the last penny – only to do a deal with the first lender that shows them a bit of ankle.
The cost of this lazy (or totally naive) decision-making is absolutely colossal. Let’s look at the brutal, compounding reality of getting your funding wrong.
The Compounding Black Hole: Bridging Finance
In bridging finance, it’s incredibly easy to overpay by £10,000 or £20,000 per loan through uncompetitive margins, hidden fees, or miscalculated leverage. If, for illustration, you’re targeting a 75% Return on Capital Employed (ROCE), on your projects, that day-one misstep means you aren’t just losing £20,000 in cash.
Firstly, consider the opportunity cost. That £20,000 overpayment is lost forever, and it’s £20,000 less equity to deploy in your next transaction. And if you’re achieving a 75% ROCE on your next project, you are also forfeiting £15,000 (£20,000×75%) in pure, unrealised profit.
So that decision to work with the first lender you spoke to has just cost you £35k by the end of your next project, and the gap keeps growing with every deal after that.
Also, because your equity pot is smaller, your next project is smaller. Smaller projects equal smaller returns.
If we track a £20,000 funding loss on deal one, compounded at a 75% ROCE across the next nine projects in a 10-deal pipeline, your business misses out on £3,078,736* in cumulative growth by deal 10.
It’s a multi-million-pound mistake that borrowers are making over and over again by not shopping the market, returning to a familiar lender, or using a broker reliant on manual loan sourcing. We call it the ‘Relationship Tax’: the hidden premium you pay for sticking with who you know.
*Here’s the maths we used.
The Institutional Disaster: Development Finance
In development finance, the numbers become catastrophic.
On a mid-market loan of a few million pounds, getting your funding structure wrong can easily leak £50,000 or more in unnecessary interest and fees. On larger facilities, those losses escalate into hundreds of thousands per project. (In fact, recent Brickflow research found an average difference in net loan of £842k between the lowest and highest leveraged deal for a £3.7m project.)
If we assume a £50,000 funding loss on deal one, compounded at that same 75% ROCE, your equity deficit grows exponentially. By the time you have completed a pipeline of 10 deals, that single, initial £50,000 mistake has chiselled a staggering £7,696,840 in cumulative lost growth out of your business ledger.
The Case of the ‘Untouchable’ Developer
One of our Broker Partners recently onboarded a prominent mid-market developer onto the Brickflow platform. Their story is a classic example of the dangers of manual loan-sourcing.
When they were first approached, they confidently told the Broker they didn't need our technology because ‘everyone in the market would lend to them’. Given their immaculate track record and reputation, that was probably true. But knowing that everyone will lend to you, and knowing who will lend the optimal loan for each project, are two completely different things.
The Broker challenged them to run their usual process: they spoke to three preferred lenders direct. All the Broker asked was that they bring the winning term sheet back to them to validate it before signing.
After two months of back-and-forth negotiations, they returned to the Broker proudly presenting a term sheet, absolutely positive it couldn’t be beaten.
The Broker ran their exact project variables through the Brickflow software. Within two minutes, our system identified an institutional lender that their manual process had completely missed. The saving? £480,000 on a single transaction.
Needless to say, they didn't sign the old term sheet. They have since used the Broker and Brickflow to procure their next three facilities, amounting to over £70m in borrowing.
This developer was completing two to three similar-sized transactions per year, and had been doing so for a decade. By relying on ‘who they knew’, they were potentially leaving over £1m in cash on the table every single year. When you compound a £1m annual loss at a 75% ROCE over a ten-year career, the opportunity cost can escalate to a mind-blowing £348m in lost portfolio growth.
The Takeaway
By all means, continue to closely manage your contractors and keep your operational overheads tight. But if you want to truly scale, you have to run a rigorous, data-led process on your finance.
It takes less than two minutes to benchmark the full breadth of the UK market on Brickflow.
Over the course of your investment career, running a proper finance process will save you more money than every single contractor negotiation combined. Stop paying the Relationship Tax. Validate your next deal on Brickflow.

Compare before you commit
Stop paying the Relationship Tax.
The first offer is only one option. Run your next project through Brickflow to compare bridging loans and development finance, with borrowing costs and equity requirements in view.
Search loans on Brickflow →
Here’s the maths we used
The calculations are based on a 75% Return on Capital Employed (ROCE) per project across a 10-deal pipeline. The money lost on deal 1 would have been reinvested as equity from deal 2 onwards, so it compounds nine times.
We use the compounding growth multiplier: if £1 of equity grows by 75% every cycle (×1.75), then after 9 cycles it has grown to £153.94.
Step by step:
- 1.75¹ = 1.75
- 1.75² = 3.0625
- 1.75³ = 5.359375
- 1.75⁴ = 9.378906
- 1.75⁵ = 16.413086
- 1.75⁶ = 28.722900
- 1.75⁷ = 50.265076
- 1.75⁸ = 87.963882
- 1.75⁹ = 153.936794
1. The Bridging Finance Workings (£20k Loss)
The £20,000 lost on deal 1, reinvested and compounding at 1.75× per deal (75% ROCE) from deal 2 to deal 10:
£20,000 × (1.75)⁹
£20,000 × 153.936794 = £3,078,736
| Deal |
Equity pool (start) |
Profit missed (75%) |
Equity pool (end) |
| 1 |
£20,000 overpaid - lost forever |
- |
- |
| 2 |
£20,000 |
£15,000 |
£35,000 |
| 3 |
£35,000 |
£26,250 |
£61,250 |
| 4 |
£61,250 |
£45,938 |
£107,188 |
| 5 |
£107,188 |
£80,391 |
£187,578 |
| 6 |
£187,578 |
£140,684 |
£328,262 |
| 7 |
£328,262 |
£246,196 |
£574,458 |
| 8 |
£574,458 |
£430,844 |
£1,005,302 |
| 9 |
£1,005,302 |
£753,976 |
£1,759,278 |
| 10 |
£1,759,278 |
£1,319,458 |
£3,078,736 |
Total lost growth by deal 10: £3,078,736
2. The Development Finance Workings (£50k Loss)
The £50,000 lost on deal 1, reinvested and compounding at 1.75× per deal (75% ROCE) from deal 2 to deal 10:
£50,000×(1.75)⁹
£50,000×153.936794 = £7,696,840
| Deal |
Equity pool (start) |
Profit missed (75%) |
Equity pool (end) |
| 1 |
£50,000 overpaid, lost forever |
- |
- |
| 2 |
£50,000 |
£37,500 |
£87,500 |
| 3 |
£87,500 |
£65,625 |
£153,125 |
| 4 |
£153,125 |
£114,844 |
£267,969 |
| 5 |
£267,969 |
£200,977 |
£468,945 |
| 6 |
£468,945 |
£351,709 |
£820,654 |
| 7 |
£820,654 |
£615,491 |
£1,436,145 |
| 8 |
£1,436,145 |
£1,077,109 |
£2,513,254 |
| 9 |
£2,513,254 |
£1,884,940 |
£4,398,194 |
| 10 |
£4,398,194 |
£3,298,646 |
£7,696,840 |
Total lost growth by deal 10: £7,696,840
3. The ‘Untouchable’ Developer Workings (£1m Loss Per Year over 10 Years)
This calculation is slightly different because it isn't just a single one-off loss; it is a recurring loss of £1,000,000 every single year for 10 years.
To calculate this, we use the Future Value of an Annuity formula, which calculates the compounding effect of regular, recurring contributions:
FV = C × [(1 + r)ⁿ − 1] ÷ r
(where C = £1,000,000, r = 0.75, n = 10.)
- Raise 1.75 to the power of 10
1.75¹⁰ = 269.3894
- Take away 1
269.3894 − 1 = 268.3894
- Divide by 0.75
268.3894 ÷ 0.75 = 357.8525
- Multiply by £1,000,000
357.8525 × £1,000,000 = £357,852,520
The Opportunity Cost: If they'd saved and reinvested that £1m every year at 75% ROCE, their portfolio potential would be worth £357.85m.
However, if they just pocketed the £1m cash savings every year without compounding it, they would have £10m.
Therefore, the net lost growth/opportunity cost to their empire from not having that capital to deploy is:
£357,852,520−£10,000,000 (cash total)=£347,852,520
If you want to avoid making multi-million pound blunders, search for your next property finance deal on Brickflow. Our loan sourcing platform is free to use, with no obligation and no credit checks – and it takes less than 2 minutes to find you the best deals from over 160 lenders.